There are several ways to collect logs in Kubernetes. For Sitecore applications running in a Kubernetes cluster, the official Kubernetes specifications and the Sitecore images support the following two approaches to expose logs outside of containers: using the default stdout container logs or using a persistent volume to share logs outside containers.
The first approach relies on the fact that Sitecore images have been instrumented with LogMonitor, a Microsoft container tool responsible to monitor log sources inside the container and to pipe a formatted output to the stdout container output. Log sources can include Windows system event logs, IIS logs and Sitecore application logs. The collected logs are all piped together and it can be challenging to filter and analyze them, because LogMonitor doesn’t enrich the logs with a source property. This challenge becomes even bigger when the Sitecore application generates multiline logs, for example when an error with its stack trace is logged: each line of a multiline log record is collected separately and they can get separated and mingled in the piped stdout output with other source logs (for example IIS logs).
The second approach consists instead in storing logs in a persistent volume, so that can be made available and stored outside the containers, in an Azure File storage resource. This configuration has been introduced recently with Sitecore 10.2 Kubernetes specifications and it has been configured for Sitecore application logs only. The same configuration could be applied for other file sources inside the containers, like for example IIS logs. This approach helps to keep different source logs separated outside the containers.
Once the logs are available outside the containers, there are different solutions that can be implemented to collect them in the desired log analytics platform. In Azure Kubernetes Service, the simplest solution is to rely on the out-of-the-box capabilities of Container Insights, that automatically collects stdout and stderr output container logs in the associated Azure Log Analytics workspace resource thanks to its containerized monitoring agents. Alternative solutions to collect and forward logs outside Azure to other analytics platforms (like for example Elasticsearch) are more complex. They usually require to use a log forwarder application (like for example FluentBit) that can be setup to run as daemon set with a pod in each cluster node to collect and forward stdout logs or as deployment to read logs from a persistent volume storage and forward them.
In the next sections I am going to describe how to enhance the collection of stdout logs of AKS cluster containers to avoid a fragmented collection of multiline logs and how to query them in the Azure Monitor targeting each source separately.
Logs Enrichment with Container Insights
Logs collected by Container Insights agents with their default configuration are decorated with the ContainerId property. When searching for logs of a container in Azure Monitor, it is very likely that you will want to search using a container name instead of its ContainerId. In that case you will need to find the ContainerId that maps to a specific container name in the KubePodInventory table and then use it in your query in the ContainerLog table to filter logs. This extra mapping step can be avoided if collected logs are enriched by the Container Insights containerized agents, adding Name (name of the container) and Image (name of the image running in the container) properties to collected log records. The enrichment can be enabled modifying the ConfigMap of the agents, as described in the following steps.
Step 1 – Download the template ConfigMap yaml file and save it as container-azm-ms-agentconfig.yaml.
Step 2 – Edit the ConfigMap template to enable container logs enrichment. An already edited version of the file can be found in the MonitoringSitecoreOnAKS repository of this series here (this version combines changes described in previous blog post of this series too).
log-data-collection-settings: |-
# Log data collection settings
# Any errors related to config map settings can be found in the KubeMonAgentEvents table in the Log Analytics workspace that the cluster is sending data to.

[log_collection_settings]

...

   [log_collection_settings.enrich_container_logs]
# In the absense of this configmap, default value for enrich_container_logs is false
      enabled = true
      # When this is enabled (enabled = true), every container log entry (both stdout & stderr) will be enriched with container Name & container Image

...
Step 3 – Deploy the updated ConfigMap in the AKS cluster executing the following command (the example command is executed from the k8s folder of the local MonitoringSitecoreOnAKS repository):
kubectl apply -f./azm-agent/container-azm-ms-agentconfig.yaml
After few minutes, once the ConfigMap has been applied successfully, you will be able to query container logs in the Azure Logs Analytics workspace of the AKS cluster, filtering by the container Name or container Image properties, like in this example query:
ContainerLog
| where Name endswith "sitecore-xp1-cm"
| limit 50
Sitecore Structured Logging
The collection of multiline logs from the stdout output of containers can be challenging if there are logs being collected by multiple sources and their individual lines get mingled together in a single piped output. For Sitecore images, multiline logs are generated by the Sitecore application when an error or an exception is stored in the logs. IIS logs are already single-line records, so they are not affected by this issue. Windows event logs could span on multiple lines, but the LogMonitor tool configuration allows to control their format via the eventFormatMultiLine property. Unfortunately this setting is not available for File source types, like Sitecore application logs.
This issue can be avoided generating Sitecore application logs in a single-line record and structuring the data in an easy-to-process format, like JSON format. Structured logging simplifies the parsing of log data and makes their analysis much easier.
Two libraries are used in Sitecore application services to log events in the file system: Log4Net, in Content Management, Content Delivery and Processing services, and Serilog, in all the other services (xdb services, cortex services and identity server). For Serilog, there is a library distributed on Nuget, called Serilog.Formatting.Compact, that already provides a compact JSON-based event format. For Log4Net instead, a custom JSON layout needs to be implemented to support this format.
The next steps describe how to add structured logging to a Sitecore 10.2 XP1 solution using a new module asset image that I implemented and shared in the structured-logging folder of my MonitoringSitecoreOnAKS repository.
Step 1 – Clone my MonitoringSitecoreOnAKS repository (if you haven’t done it yet).
Step 2 – In your local structured-logging folder, open the .env file and populate the following environment variables:
COMPOSE_PROJECT_NAME– The name of your project solution to prefix the image name.REGISTRY– The domain of your Azure Container Registry (ending with a slash).
Step 3 – Build the structured-logging asset module image, executing the following command in Powershell:
docker-compose build
Step 4 – Push the image to the Azure Container Registry resource used by the AKS cluster, executing the following command:
docker-compose push
Step 5 – Add the structured-logging asset module image to your Sitecore 10.2 instance images, following the same usual process described in the “Add Sitecore modules” Sitecore documentation page here. I also shared an example of this installation setup to add this module in the structured-logging branch of my forked docker-examples Sitecore repository in the custom-images folder here.
Step 6 – Build your custom Sitecore images, using your existing build pipeline (if you have one). If you are using the example that I shared in my forked docker-examples repository, then you can build the custom images executing the following command in the custom-images local folder in Powershell:
docker-compose -f .\docker-compose.xp1.yml -f .\docker-compose.xp1.override.yml build
Step 7 – If you have built your custom images locally, push them to your Azure Container Registry, executing the following command in Powershell:
docker-compose -f .\docker-compose.xp1.yml -f .\docker-compose.xp1.override.yml push
Step 8 – Deploy your custom images to your AKS cluster, using your deploy pipeline (if you have one). If you are manually deploying images to your AKS cluster, you can use the following command for each deployment Sitecore service in the cluster, using the correct image and targeting the correct deployment in the sitecore namespace:
kubectl set image deployments/cm sitecore-xp1-cm=your_registry/<compose_project_name>-xp1-cm:<version> -n sitecore --record
Once the deployment is successfully complete, Sitecore application logs in the stdout output of containers will be single-line log events with a JSON-based format.
This is an example of generated Log4Net JSON-based event. The custom log4net layout implementation in my asset module image includes the ability to enrich log events with logtype and role properties.
{"timestamp":1652133759181,"thread.name":"ManagedPoolThread #3","message":"Exception","log.level":"ERROR","logger.name":"Sitecore.Jobs.DefaultJobStatus","logtype":"Sitecore","role":"CM","error.message":"Exception has been thrown by the target of an invocation.","error.stack":" at System.RuntimeMethodHandle.InvokeMethod(Object target, Object[] arguments, Signature sig, Boolean constructor)\r\n at System.Reflection.RuntimeMethodInfo.UnsafeInvokeInternal(Object obj, Object[] parameters, Object[] arguments)\r\n at System.Reflection.RuntimeMethodInfo.Invoke(Object obj, BindingFlags invokeAttr, Binder binder, Object[] parameters, CultureInfo culture)\r\n at Sitecore.Reflection.ReflectionUtil.InvokeMethod(MethodInfo method, Object[] parameters, Object obj)\r\n at Sitecore.Jobs.JobRunner.RunMethod(JobArgs args)\r\n at (Object , Object )\r\n at Sitecore.Pipelines.CorePipeline.Run(PipelineArgs args)\r\n at Sitecore.Pipelines.DefaultCorePipelineManager.Run(String pipelineName, PipelineArgs args, String pipelineDomain, Boolean failIfNotExists)\r\n at Sitecore.Pipelines.DefaultCorePipelineManager.Run(String pipelineName, PipelineArgs args, String pipelineDomain)\r\n at Sitecore.Jobs.DefaultJob.DoExecute()\r\n at Sitecore.Abstractions.BaseJob.ThreadEntry(Object state)","error.class":"System.String"}
This is an example of Serilog JSON-based compact event, that leverages the structured capabilities offered by the Serilog library:
{"@t":"2022-05-11T03:21:33.3915685Z","@mt":"{HostingRequestFinishedLog:l}","@r":["Request finished in 6.6511ms 200 text/plain"],"ElapsedMilliseconds":6.6511,"StatusCode":200,"ContentType":"text/plain","HostingRequestFinishedLog":"Request finished in 6.6511ms 200 text/plain","EventId":{"Id":2},"SourceContext":"Microsoft.AspNetCore.Hosting.Diagnostics","RequestId":"0HMHIV9GA3TE6:00000001","RequestPath":"/healthz/live","SpanId":"00b7bcbbeb6a2041","TraceId":"98a21843fe74e84d893f1def0cfc658c","ParentId":"0000000000000000","ConnectionId":"0HMHIV9GA3TE6","MachineName":"ID-5856B986F7-R","Application":"Sitecore Identity"}
Keep in mind that structured logs might be hard to read if not analyzed through a log analytics tool, so they are not recommended to be used for local development or in environments that are not instrumented with monitoring.
Logs Source Filtering
The LogMonitor tool doesn’t support the ability to enrich logs with their log type or source. For Sitecore Log4Net logs, the custom structured logging implementation adds the logtype property that can be used to distinguish Sitecore logs from IIS logs or Windows event logs when querying logs using the Azure Kusto query language in Azure Monitor. For other types of logs or for other Sitecore services using Serilog, other structured properties or exact parsing for a specific layout format (like for example for IIS logs) can help to distinguish logs.
Structured properties in JSON-based log messages can be mapped to an object using the todynamic function of the Kusto query language.
The following sections show examples of queries that can be used to review logs for each log source, and of course they can be used in dashboards to visualize specific logs or their distributions.
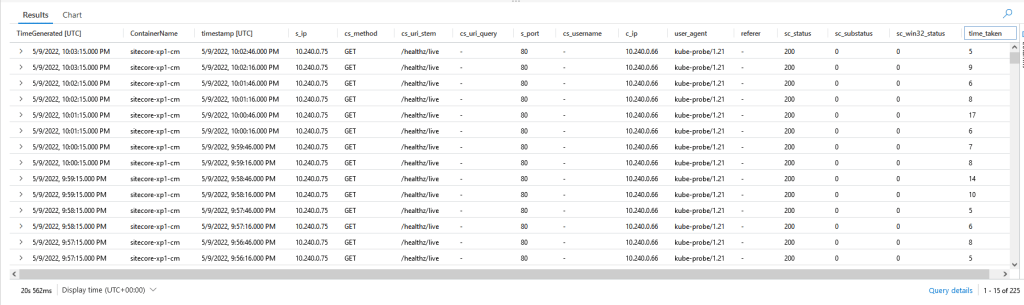
IIS Logs Query
This query uses the parse-where function for exact parsing of IIS logs, since they have well-defined format.
ContainerLog
| extend ContainerName=split(Name, '/')[1]
| where ContainerName ==  "sitecore-xp1-cm"
| parse-where kind=simple LogEntry with dt:datetime " " ts:timespan " " s_ip " " cs_method " " cs_uri_stem " " cs_uri_query " " s_port " " cs_username " " c_ip " " user_agent " " referer " " sc_status:int " " sc_substatus " " sc_win32_status " " time_taken
| project TimeGenerated, ContainerName, ["timestamp"]=dt+ts, s_ip, cs_method, cs_uri_stem, cs_uri_query, s_port, cs_username, c_ip, user_agent, referer, sc_status, sc_substatus, sc_win32_status, time_taken
| order by timestamp desc
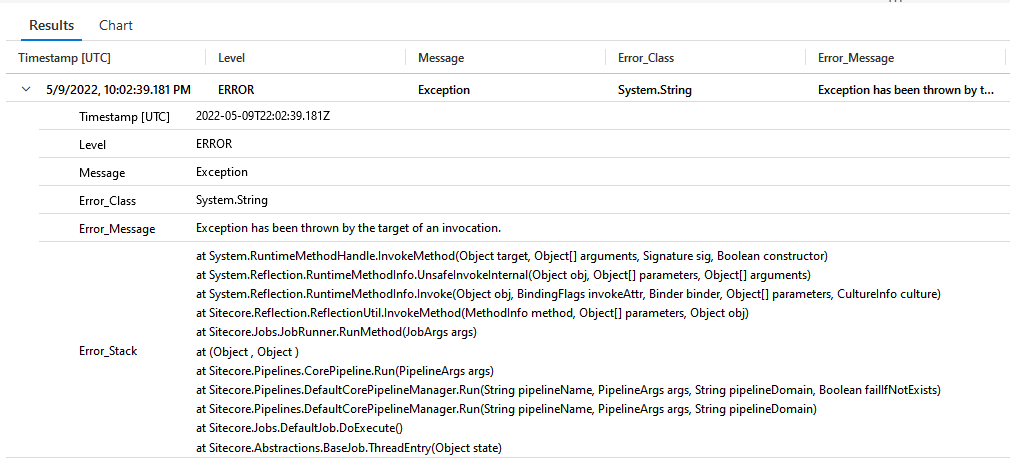
Sitecore Logs Query
For Log4Net structured logs, log level and logtype properties can be used to filter them:
ContainerLog
| extend ContainerName=split(Name, '/')[1]
| where ContainerName == "sitecore-xp1-cm"
| order by TimeGenerated desc
| extend StructuredProperties = todynamic(LogEntry)
| where StructuredProperties["logtype"]=="Sitecore"
| project ["Timestamp"]=unixtime_milliseconds_todatetime(todouble(StructuredProperties["timestamp"])), ["Level"]=StructuredProperties["log.level"],["Message"]=StructuredProperties["message"],["Error_Class"]=StructuredProperties["error.class"],["Error_Message"]=StructuredProperties["error.message"],["Error_Stack"]=StructuredProperties["error.stack"]
| where Level in ("ERROR","WARN")
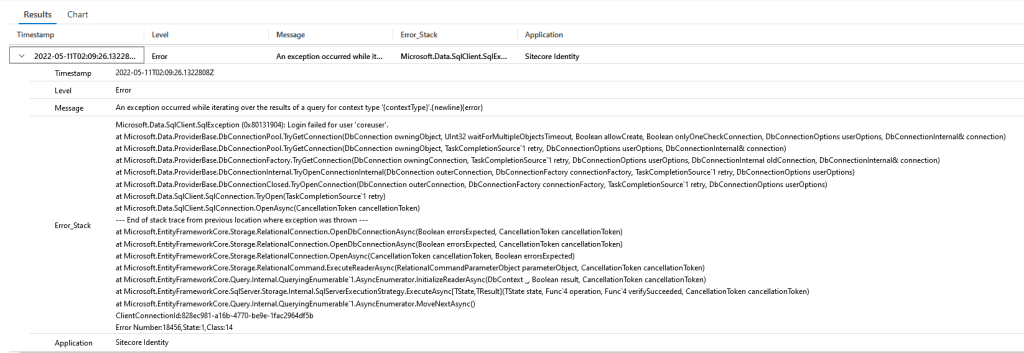
For Serilog structured logs:
ContainerLog
| extend ContainerName=split(Name, '/')[1]
| extend StructuredProperties = todynamic(LogEntry)
| extend ["Application"]=StructuredProperties["Application"], ["Level"]=StructuredProperties["@l"], ["Message"]=StructuredProperties["@mt"], Timestamp = StructuredProperties["@t"], Error_Stack = StructuredProperties["@x"]
| where ContainerName == "sitecore-xp1-id" and tostring(Timestamp) != ""
| order by TimeGenerated desc
| project Timestamp,Level,Message,Error_Stack, Application
Windows Event Logs Query
This query filters Windows Event logs per exclusion of Sitecore logs and IIS logs:
ContainerLog
| extend ContainerName=split(Name, '/')[1]
| where ContainerName == "sitecore-xp1-cm"
| order by TimeGenerated desc
| where LogEntry !contains "timestamp" and LogEntry !contains "@t"
| parse kind=simple LogEntry with dt:datetime " " ts:timespan *
| where tostring(dt)==""
Conclusions
In this blog post I described how to enhance the collection of stdout container logs of a Sitecore XP1 10.2 solution running in an AKS cluster, adopting structured logging to avoid fragmented collection of multiline logs and using parsing functions in queries to filter each log type separately.
If you have any questions, please don’t hesitate to reach out or comment on this post. Thank you for reading and stay tuned for the next post!
