In the previous post of this series I described the steps to create a new monitoring namespace in an existing Sitecore AKS cluster and to install two important tools for metrics collection and data visualization: Prometheus and Grafana. In this blog post I will describe how to enhance and configure Grafana data sources to collect metrics from internal and external AKS cluster resources. I will also describe and share a comprehensive collection of Grafana dashboards to visualize the collected metrics.
Grafana Data Sources
Grafana natively supports a large variety of data sources. The following two data sources are fundamental to access metrics from all resources of an AKS cluster: Prometheus and Azure Monitor.
Prometheus Data Source
Grafana is automatically configured with the Prometheus data source during its installation process. Any metrics collected by Prometheus can be explored and visualized in Grafana without the need of any additional step. Which metrics are collected depends on the Prometheus data scraping configuration and on the presence of Prometheus annotations and service metrics exporters on the individual AKS cluster resources.
Prometheus Service Discovery
Prometheus has the ability to auto-discover exporter services and pods to monitor, but its discovery is restricted by default to its namespace unless differently configured. In order to discover metrics from any service or pod in the AKS cluster, the following two settings in the Prometheus chart need to be edited as follows:
prometheus.prometheusSpec.podMonitorSelectorNilUsesHelmValues=false
prometheus.prometheusSpec.serviceMonitorSelectorNilUsesHelmValues=false
The updated settings can be applied to an existing Prometheus instance using the helm upgrade command or, if a values.yml configuration file was used during the installation with its Helm chart (as the one that I provided in my MonitoringSitecoreOnAKS GitHub repository here), the instance can be updated using the following command:
helm upgrade -f ./prometheus/values.yaml prometheus prometheus-community/kube-prometheus-stack -n monitoring
The service discovery can be used for example to scrape metrics from the Ingress NGINX controller in the AKS cluster, but first its service monitor needs to be enabled, as described in the next section.
NGINX Ingress Controller Metrics Collection
If the NGINX Ingress controller was installed in the existing AKS cluster using the ingress-nginx Helm chart, then the following helm upgrade command can be used to update its configuration to enable the metrics monitoring and its service monitor:
helm upgrade nginx-ingress ingress-nginx/ingress-nginx--namespace ingress-basic--set controller.metrics.enabled=true --set controller.metrics.serviceMonitor.enabled=true` --set controller.metrics.serviceMonitor.additionalLabels.release="prometheus"
The controller.metrics.serviceMonitor.additionalLabels.release="prometheus" should match the name of the Helm release of the kube-prometheus-stack chart used to install Prometheus and Grafana.
A good practice is to verify after a successful command execution that the desired metrics are exposed and that Prometheus is collecting them, accessing the Prometheus Web UI (with a port-forward command) and to query for them. In this particular case, searching for nginx should list all NGINX metrics.
Azure Monitor Data Source
The Azure Monitor data source for Grafana is a must-have source to get access to metrics and logs from Azure resources used by or connected to the Sitecore AKS cluster. Grafana includes built-in support for Azure Monitor (its plugin is installed by default) and the Azure Monitor data source can be configured in the Data Sources sub-section of the Grafana Configuration section. This data source requires to create an app registration and service principal in Azure Active Directory that can be used to authenticate the data source, using the Directory (tenant) ID, the Application (client) ID and the Client Secret:

The Azure Service Principle identity requires to have the Monitoring Reader access role to the cluster Log Analytics workspace resource, in order to be granted read access to all monitoring data.
The type of data collected in Azure Monitor is controlled by configuring the data streaming export in the Diagnostic Settings section of each Azure resource and selecting the cluster Logs Analytics workspace as destination.
The Sitecore 10.2 XP1 topology in my AKS cluster uses two external resources in Azure: an Azure SQL Elastic Pool instance, for the application databases, and an Azure Cache for Redis instance, for private and analytics session stores. Their diagnostic data has been configured to be exported in the Logs Analytics workspace. The same configuration can be applied for any Azure resources that we want their metrics to be streamed and accessible in Azure Monitor.
Grafana Dashboards Collection
Once the Grafana data sources have been configured successfully, the collected metrics can be visualized in dashboards to make it easier to identify patterns, trends and outliers. Grafana allows to export and share dashboards in a very efficient way thanks to the JSON template export format and the support of template variables. In the following section, I am going to share eight dashboards that I customized or built from scratch to visualize the monitoring data of a Sitecore AKS solution.
1. Azure Monitor for Containers Metrics Dashboard
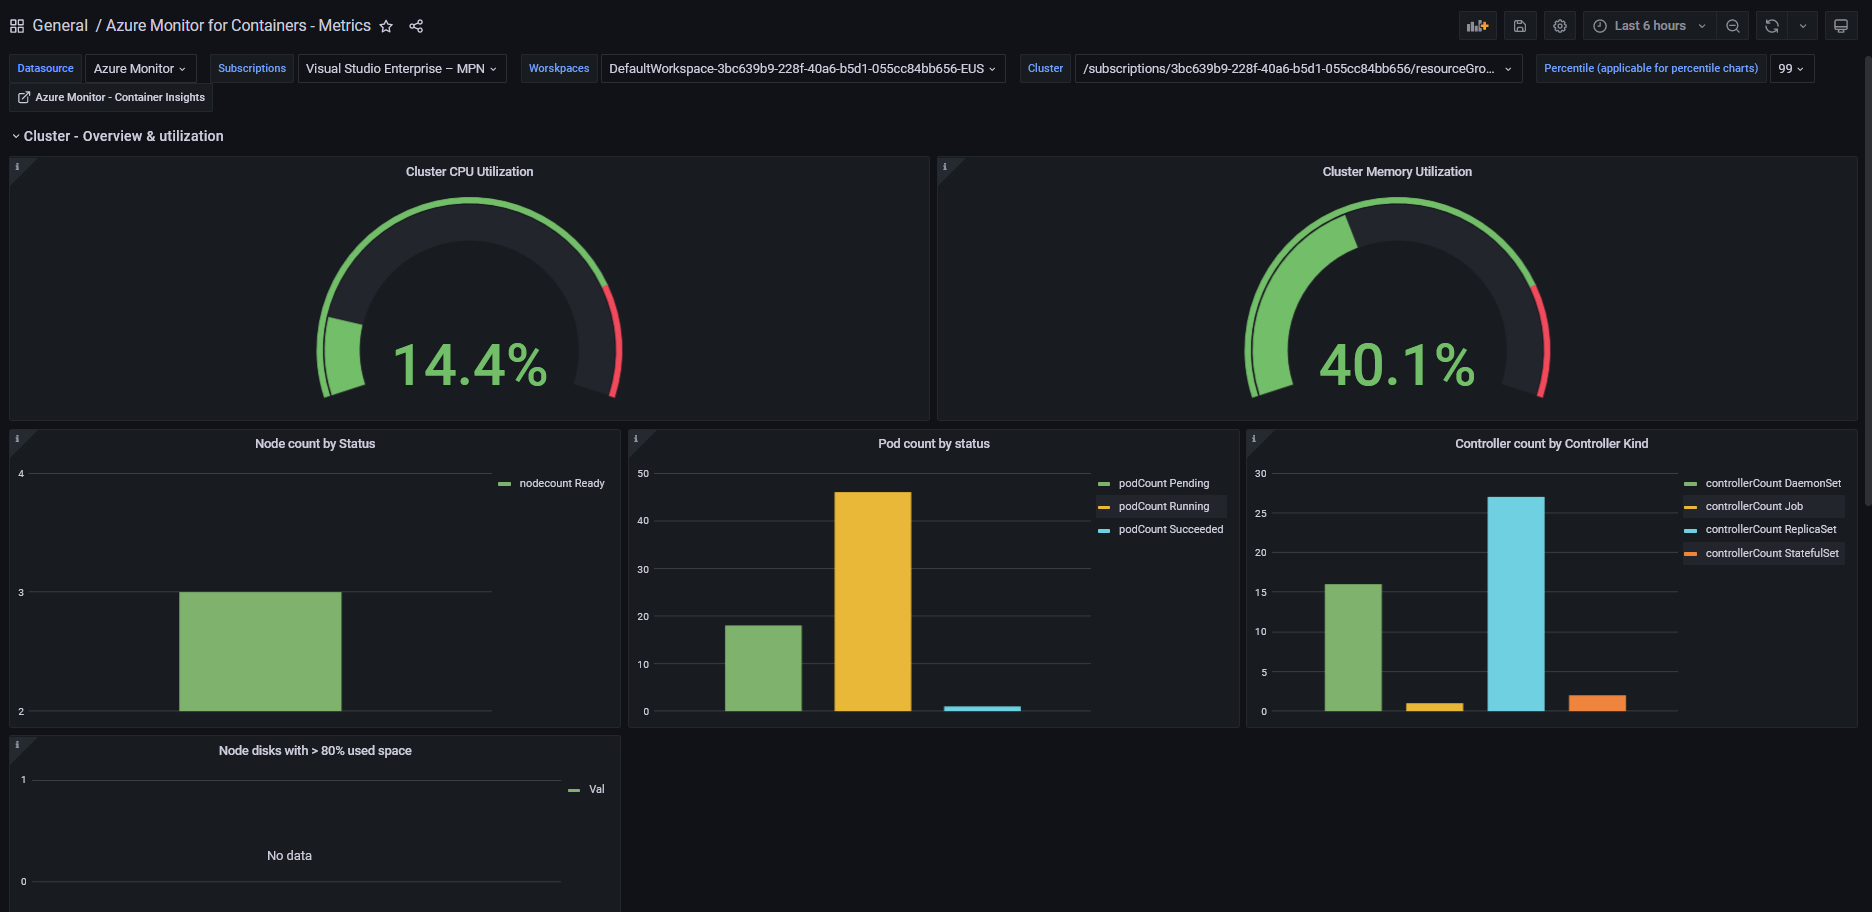
JSON Template: https://raw.githubusercontent.com/afaniuolo/MonitoringSitecoreOnAKS/main/grafana-dashboards/azure-monitor-for-containers-metrics.json
Data Source: Azure Monitor
This dashboard displays Azure Container Insights metrics of the AKS cluster (resource utilization at cluster level and namespace level). Its JSON template is based on the original dashboard ID 10956, where I fixed the Cluster ID template variable.
2. AKS Container Insights Dashboard

JSON Template: https://raw.githubusercontent.com/afaniuolo/MonitoringSitecoreOnAKS/main/grafana-dashboards/aks-container-insights-with-variables.json
Data Source: Azure Monitor
This dashboard offers a global view for listing all pods and containers in one or more AKS clusters (useful for a multi-region setup). This dashboard requires the installation of the Worldmap Panel plugin, already available in the Grafana Plugins section. Its JSON template is based on the original dashboard ID 12180, where I fixed the Subscription and the Log Analytics Workspace template variables.
3. Pod Overview for AKS Dashboard
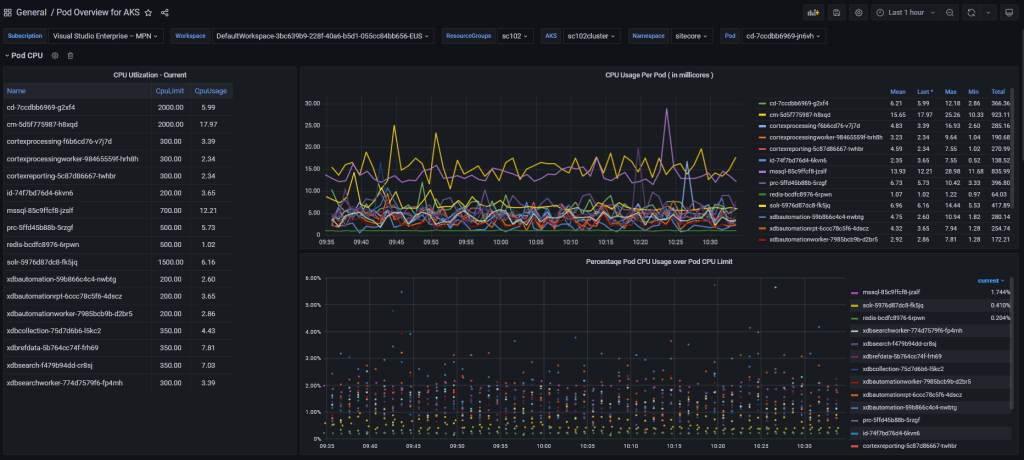
JSON Template: https://raw.githubusercontent.com/afaniuolo/MonitoringSitecoreOnAKS/main/grafana-dashboards/pod-overview-for-aks.json
Data Source: Azure Monitor
This dashboard provides a view of collected metrics at pod and container level, that can be filtered by cluster, namespace and pod. The dashboard has been customized to include live logs from the selected pod. Its JSON template is based on the original dashboard ID 14891, with the addition of the live logs panel and the Pod template variable.
4. Windows Node Metrics Dashboard
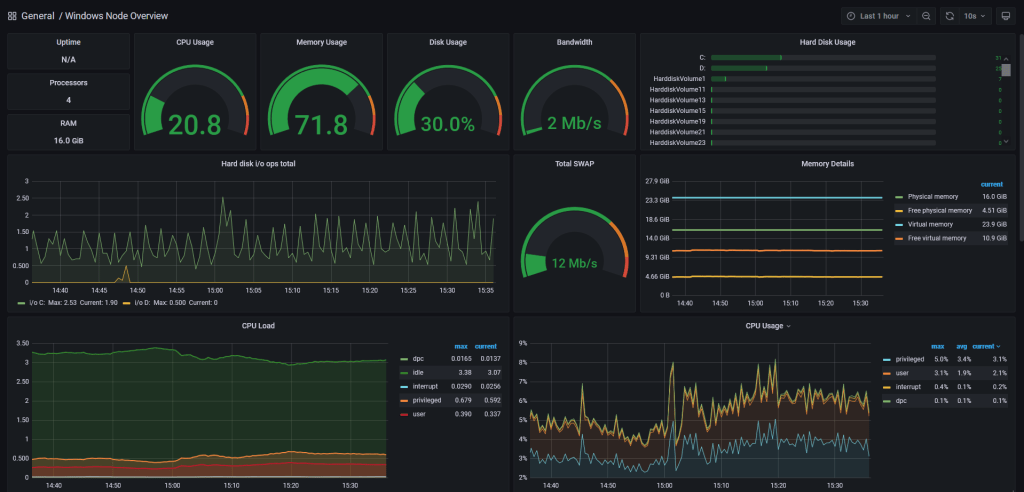
JSON Template: https://raw.githubusercontent.com/afaniuolo/MonitoringSitecoreOnAKS/main/grafana-dashboards/Windows-Exporter-Dashboard.json
Data Source: Prometheus
This dashboard displays metrics collected by Windows nodes in the AKS cluster, exposed and collected by Prometheus thanks to the solution described in my previous post.
5. Linux Exporter Node Dashboard
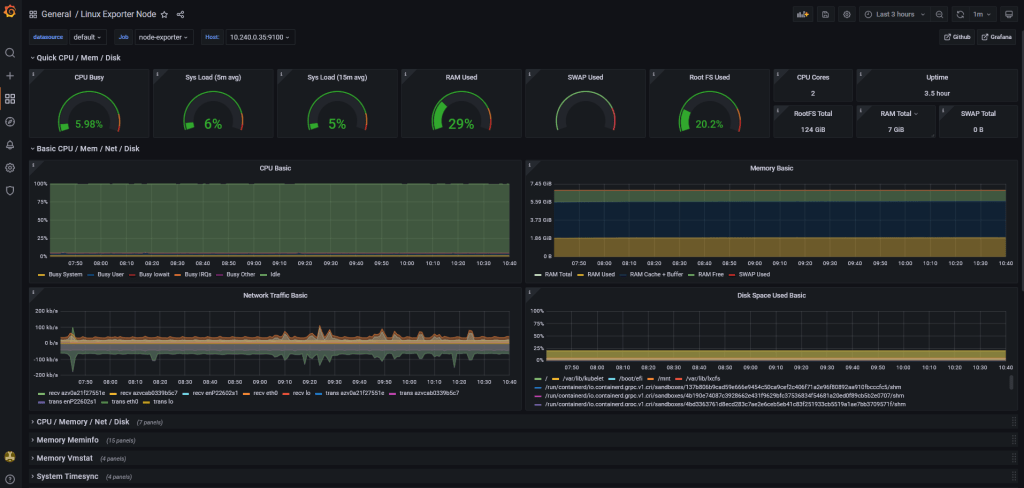
JSON Template: https://grafana.com/grafana/dashboards/1860
Data Source: Prometheus
This dashboard displays resource metrics collected from Linux nodes in the cluster, thanks to the native Prometheus Linux node exporter daemon set.
6. NGINX Ingress Controller Dashboard
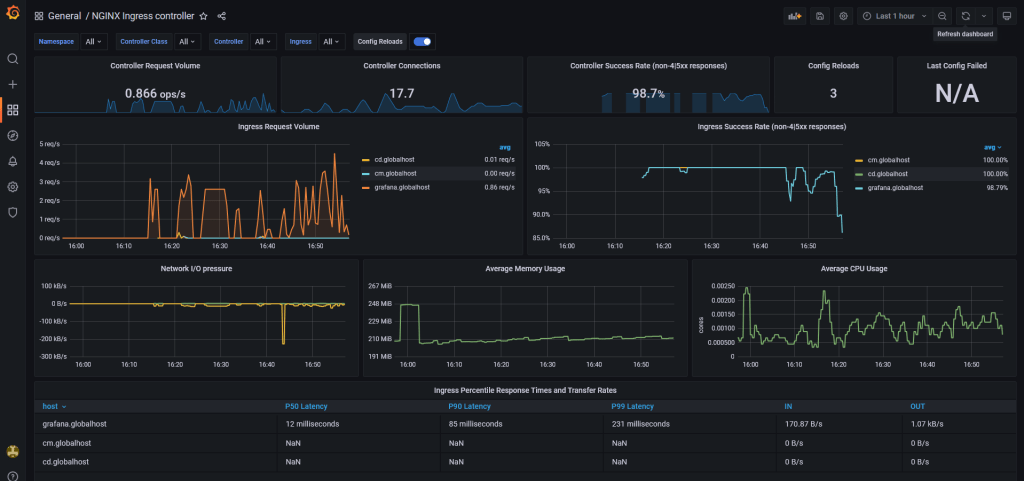
JSON Template: https://raw.githubusercontent.com/afaniuolo/MonitoringSitecoreOnAKS/main/grafana-dashboards/nginx-ingress-controller-by-host.json
Data Source: Prometheus
This dashboard displays metrics collected from the NGINX Ingress Controller resource, used by both Sitecore and Grafana. Its metrics include request volume, connections, success rates, config reloads and configs out of sync, network IO pressure, memory and CPU use, and ingress percentile response times. Its JSON template is based on the original dashboard ID 9614, where I edited the charts to group data by individual host instead of ingress resource.
7. Azure SQL Elastic Pool / Databases Dashboard
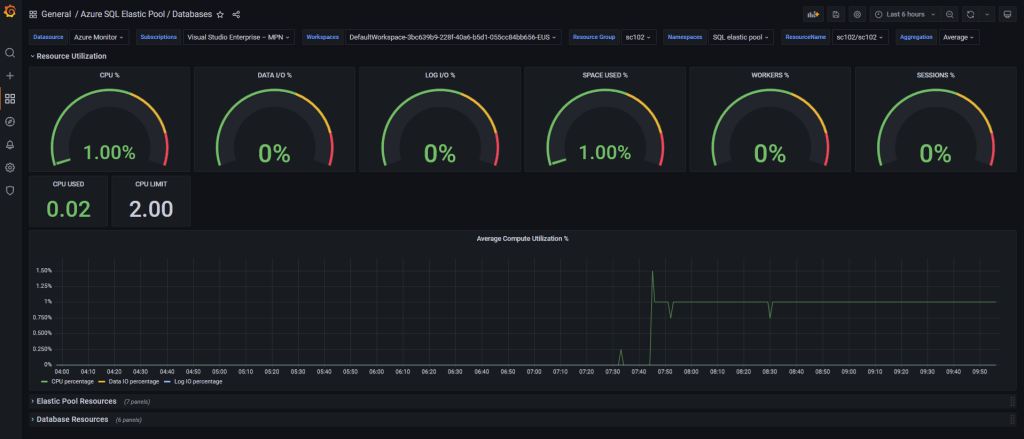
Data Source: Azure
This dashboard displays Azure SQL Elastic Pool and Azure SQL databases resource metrics in terms of CPU, Data IO and Logs IO utilization, connections, workers and sessions. This dashboard was built from scratch, because shared dashboards available in Grafana were not compatible with the new version of the Azure Monitor plugin.
8. Azure Redis Dashboard
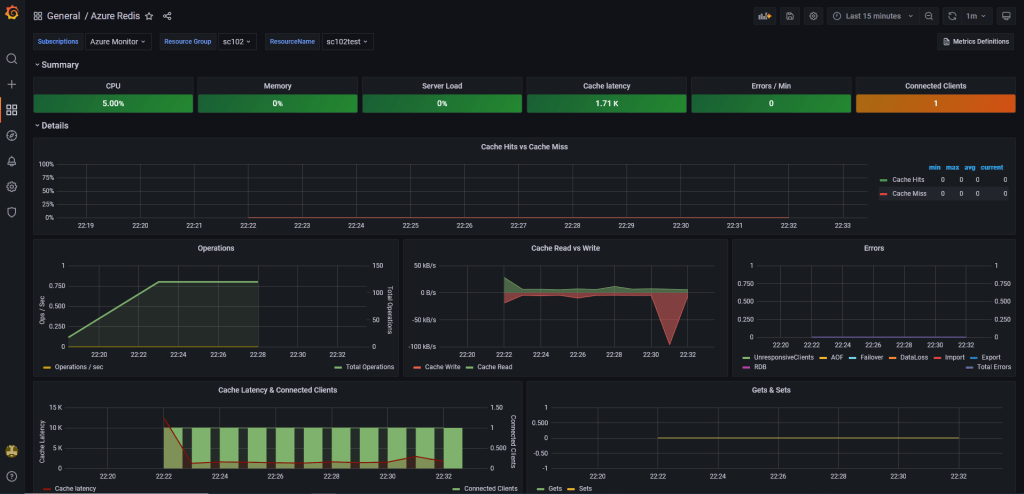
JSON Template: https://grafana.com/grafana/dashboards/10534
Data Source: Azure
This dashboard displays metrics for an Azure Cache for Redis resource, in terms of CPU, memory, server load, connections, errors, cache hits, operations and many more.
Conclusions
In this blog post I described how to configure two important data sources for Grafana to visualize metrics collected for a Sitecore solution hosted in an Azure Kubernetes Service cluster. I also shared my dashboards collection, aimed to provide a solid initial setup to discover the behavior of your containerized system. Feel free to import these dashboards, but also to modify them and create new ones that best fits your solution needs.
If you have any questions, please don’t hesitate to reach out or comment on this post. Thank you for reading and stay tuned for the next post of the Monitoring Sitecore on AKS series!
