With the release of the Sitecore 10 platform a couple of years ago, Sitecore started to support running applications in containers and provided guidance on how to deploy a containerized Sitecore application to a Kubernetes cluster. Since then, Kubernetes specification files are now included in each new Sitecore release and a full example of the deployment process has been shared in the newly launched Sitecore MVP site GitHub repository.
The containerized approach is meant to compete with the established Sitecore PaaS approach, that instead consists in running the Sitecore platform in Microsoft Azure cloud platform using PaaS resources (like for example app services and app service plans). The path to adopt Sitecore containerized applications in production is still in its early phase, but it is gradually growing and progressing.
An area that could speed up the adoption and help with building confidence in running Sitecore on Kubernetes in production is monitoring. For Sitecore PaaS, monitoring has always been an integrated part of the delivered solution, thanks to the Sitecore Application Level Monitoring module (distributed as ARM templates on the Sitecore Azure Quickstart Templates repository) and the embedded instrumentation for Application Insights for all Sitecore role instances. With the introduction of containers, monitoring assets have been removed (or disabled) from the Sitecore application and there is no direct documentation support on how to procure and configure monitoring tools in Kubernetes. This choice has made the Sitecore containerized application agnostic of a particular hosting platform (AKS, EKS, GKE, …), but at the same time has removed a must-have feature for managing a complex application in production.
Why is Monitoring Important?
In Site Reliability Engineering, monitoring is the bottom layer of the service reliability hierarchy pyramid, because without monitoring you don’t have any visibility on the behavior of your system and no way to know if it is working as expected or not.
A monitoring solution can help to detect and investigate outages, service degradations or bugs when they occur, but it can also provide indicators that can help to predict possible future issues.
Monitoring can also help to measure the current state of the system to ensure that it has adequate resources to run. It can help to identify long-term website traffic trends that can be used for capacity planning, to ensure that the system is sized adequately to process the future expected load.
A monitoring solution can also help to expose unexpected side effects introduced with the deployment of code changes or new entire functionalities on a website.
Monitoring can be split in two main sub-topics: instrumentation and collection of telemetry data (metrics, logs and traces), and computation (aggregation and reporting) and alerting on the collected data.
A New Series
If you search for Sitecore containers monitoring in the Sitecore documentation portal, you will find today only one Knowledge Base article about this topic for containers: Sitecore Managed Cloud Containers Monitoring. The article provides a graphical overview of the monitoring infrastructure model and a high level description of dashboards and alerts. While the article is useful to understand what blocks you might need to implement a monitoring solution for a containerized Sitecore application, it doesn’t provide instructions on how to do it.
For this reason, I decided to start a new series of blog posts about monitoring a containerized Sitecore application in Azure Kubernetes Service (AKS), where I will document and share my effort to implement a monitoring solution. This series will describe aspects of the instrumentation and tooling configuration, with the goal to collect all three main telemetry data types: metrics, logs, and traces.
While concepts discussed in this series will be mainly explored using Sitecore 10.2 and Azure Kubernetes Service (AKS), some of them will be agnostic of the particular hosting platform or the particular orchestration service used.
Default Monitoring Instrumentation
I will start this journey describing the monitoring instrumentation that is already available out of the box when performing a standard procurement of a Sitecore containerized application, applying the Kubernetes specifications for Sitecore XP 10.2 in Azure Kubernetes Service.
Metrics
Metrics are simply measurements taken inside a system, representing the state of that system in a measurable way. These are almost always numeric and tend to take the form of counters, distributions, and gauges.
Google Cloud – DevOps measurement: Monitoring and observability
Azure offers the native ability to monitor the performance of container workloads in an AKS cluster when the Container Insights feature is enabled, collecting memory and processor metrics from controllers, nodes, and containers that are available in Kubernetes through the Metrics API. Container Insights supports clusters with nodes running Linux or Windows operating system.
Container Insights can be enabled when a new AKS cluster is created, for example adding the --enable-addons monitoring option to the az aks create Azure CLI command (see also Azure documentation to create a new cluster here). It can also be enabled on an existing AKS cluster, using the az aks enable-addons -a monitoring command in the Azure CLI (see also Azure documentation here for different deployment options with existing clusters).
When the Container Insights feature is enabled on an AKS cluster, the following additional resources are created in a separate resource group: a Log Analytics workspace resource, this is the basic management unit for Azure Monitor logs, containing its own data repository and where the collected telemetry data is stored; and a Container Insights solution resource. A omsagent-rs replica set and two deamon sets (omsagent and omsagent-win, one for Linux nodes and one for Windows nodes) are deployed to the AKS cluster. The omsagent-rs-config config map, that defines the instrumentation sources and the collection execution interval (the default is every 60 seconds), is also added to the AKS cluster configurations.
Container Insights monitoring data can be accessed directly from the AKS cluster resource browsing the options available under the Monitoring section on the left navigation in the portal.

A big limitation with the default monitoring instrumentation is that metrics from Windows nodes pools are not available. The reason of this limitation is because, as of today, Windows containers don’t have the required privileged permissions to access information from their host machine. For this reason, performance metrics for Windows nodes, like CPU usage or memory working sets, are computed (and not directly collected) based on the node capacity or the pods allocation, and host disk storage metrics are not available at all.
Logs
An event log is an immutable, timestamped record of discrete events that happened over time. Event logs in general come in three forms but are fundamentally the same: a timestamp and a payload of some context. The three forms are plaintext, structured and binary.
O’Reilly – Distributed Systems Observability by Cindy Sridharan
In addition to metrics collection, Container Insights offers also the ability to collect container logs, in particular stdout output and stderr output of containers, that are respectively the output of commands executed inside a container and the output error messages. Collected logs can be queried in the Log Analytics resource of the AKS cluster using the Azure Kusto query language (if you have already worked with Sitecore Azure PaaS solutions, if you are already familiar with this language!).
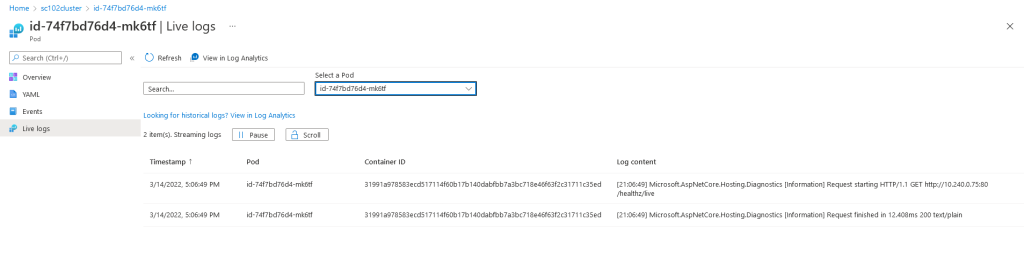
Container Insights also offers an advanced diagnostic feature, called Live Data, that provides direct access to logs and metrics from AKS containers. Having access to live resource logs (not only from individual containers, but also pods, replica sets and deployment resources) is an important feature to troubleshoot issues in real time, in particular during initial procurement and initialization of a cluster or during a deployment.
IIS logs, Sitecore application logs and Windows system event logs are automatically collected in sdtout container logs, because Sitecore images have been instrumented with LogMonitor, a Microsoft application responsible to monitor log sources inside the container and to pipe a formatted output to the sdtout container output. An important thing to keep in mind is that not all Sitecore logs are getting collected with the default configuration defined in the native Sitecore images (stored in the C:\LogMonitor\LogMonitorConfig.json configuration file in their file system), but only logs written in log files that have a name that match the log.*.txt pattern.
There are two big limitations to be aware of when collecting logs with LogMonitor:
- There is no ability to distinguish and filter the internal source of the collected log records, for example to aggregate and compute only IIS logs or Sitecore logs separately.
- Multiline logs (like for example error log event with stack traces and multiple nested exceptions) are split and collected in individual log records for each of their lines, complicating their analysis and visualization.
Traces
Traces are composed of spans, which are used to follow an event or user action through a distributed system. A span can show the path of a request through one server, while another span might run in parallel, both having the same parent span. These together form a trace, which is often visualized in a waterfall graph similar to those used in profiling tools. This lets developers understand time taken in a system, across many servers, queues, and network hops.
Google Cloud – DevOps measurement: Monitoring and observability
Sitecore images don’t have any instrumentation in place to track traces telemetry data, for requests or for dependencies calls to external services. This represents an important gap in comparison of what is still natively provided in Sitecore Azure PaaS solutions, that are instead already instrumented with a code-based implementation of Application Insights monitoring. Distributed tracing is a must-have feature in any complex multi-services application, like the Sitecore platform, to efficiently troubleshoot issues and understand the different behaviors of a production web application.
Stay tuned
In future posts of this series, I will describe and share solutions to mitigate the existing gaps and limitations in the default monitoring instrumentation that I discussed in this post, covering all three pillars of telemetry data: metrics, logs and traces. In the meantime, if you have any questions, please don’t hesitate to reach out or comment on this post.
Thank you for reading and stay tuned for the next post!
