When working with a containerized distributed platform like Sitecore, it is important to be able to monitor metrics of all critical resources in its AKS cluster. The Container Insights monitoring feature available in AKS provides valuable data for the platform and the containerized application, but lacks deeper metric collection at workload level. For this reason, a couple of years ago Microsoft launched a native capability to integrate Azure Monitor with Prometheus, a popular open-source metric monitoring solution.
Prometheus collects metrics as time series: a series of timestamped values belonging to the same metric and indexed in time order. The metrics collection occurs via a pull model over HTTP from collection targets identified dynamically through service discovery or via static configuration. Metrics from a target can be exposed in Prometheus metrics data format implementing a custom HTTP endpoint using a client library (there are many available in different languages, including .NET / C#) or using a third-party exporter that collects, converts and exposes the metrics over HTTP.
Prometheus metrics data can be queried in the Prometheus Web UI using its own PromQL query language. Or, for a much more intuitive and robust experience, they can be visualized in Grafana, an open source data visualization solution, that allows to query, visualize and alert on data collected from multiple sources, including the Prometheus API.
Both Prometheus and Grafana are two important must-have additions to the monitoring stack of an AKS cluster. In the next sections, I will describe how to install and configure Prometheus and Grafana in an existing AKS cluster, how to export host metrics from a Windows node in the cluster and how to access them in the Azure Log Analytics workspace of the cluster and in Grafana.
Prometheus and Grafana Installation
In this section I am going to describe how to install Prometheus and Grafana with Helm in an existing AKS cluster with both Linux and Windows nodes, where Sitecore assets have already been deployed. If you haven’t procured a Sitecore instance in AKS yet, the “Installation Guide for Production Environment with Kubernetes” (available on the Sitecore download portal here) explains the procurement process in details.
Prometheus and Grafana will be installed together using the prometheus-community/kube-prometheus-stack Helm chart. In order to successfully execute the next steps, you will need to have access to the AKS cluster using the Kubernetes CLI (kubectl) and Helm in Powershell.
In the next steps, I am going to refer to Kubernetes specification files and other configuration files that will be created and stored in the same local folder where I have previously extracted the Sitecore “Container Deployment Package“, used to procure and deploy Sitecore on an AKS cluster. For reference, I shared all additional files used in the next steps in my MonitoringSitecoreOnAKS GitHub repository here. Clone it locally on your machine to simplify the execution of the following steps.
Step 1 – Create a new namespace in the AKS cluster, called “monitoring“, executing the following command:
kubectl create namespace monitoringStep 2 – Add the prometheus-community Helm repository, executing the following command:
helm repo add prometheus-community https://prometheus-community.github.io/helm-charts
Step 3 – Generate a TLS certificate and admin credentials secrets for Grafana. If you have cloned my repository, execute the GenerateGrafanaTLSCert.ps1 Powershell script to generate the certificate. Populate the two secrets in the grafana-secrets folder: admin-user and admin-password.
Note: be sure that the secrets files don’t contain any break-line character (they need to be a single-line text value).
Step 4 – Deploy Grafana secrets in the monitoring namespace executing the following command in the root k8s folder of the local repository:
kubectl apply -k ./grafana-secrets -n monitoring
Step 5 – Install the prometheus-community/kube-prometheus-stack Heml chart with configuration parameters (defined in a customized values.yaml configuration file) in the monitoring namespace, executing the following command:
helm install -f ./prometheus/values.yaml prometheus prometheus-community/kube-prometheus-stack -n monitoring
The original values.yaml configuration file is distributed in the official Prometheus chart repository here. These are the main changes that have been implemented:
- The
nodeSelectorproperties for all the Prometheus components have been set tokubernetes.io/os: linuxto ensure that the installation process installs chart components in the Linux node of the AKS cluster. This property has been also added to components that don’t have one, like theprometheus-node-exportercomponent, to avoid to install it on a Windows node, where the container pod would fail to start. podAnnotationshave been defined for theprometheus-node-exportercomponent to define the prometheus scraping HTTP service (it is needed for the integration with Container Insights):
prometheus-node-exporter:
...
  podAnnotations: {
    "prometheus.io/scrape":"true",
    "prometheus.io/scheme":"http",
    "prometheus.io/path":"/metrics",
    "prometheus.io/port":"9100"
  }
- Grafana has been configured to enable the Grafana Ingress; to enable a persistence volume to permanently store Grafana data (for example, the Grafana dashboards) in an Azure File Disk storage; and to configure administrator user credentials. The secrets and TLS certificates generated for Grafana at Step 3 and 4 are respectively used in the
admincredentials configuration and in theingressconfiguration. The domain used in this example isgrafana.globalhost.
grafana:
  ...
  nodeSelector:
    kubernetes.io/os: linux

  ...

  # adminUser: admin
  # adminPassword: prom-operator

  # Use an existing secret for the admin user.
  admin:
    existingSecret: "prometheus-grafana"
    userKey: admin-user
    passwordKey: admin-password

  ...

  ingress:
    ## If true, Grafana Ingress will be created
    ##
    enabled: true

    ## Annotations for Grafana Ingress
    ##
    annotations:
     kubernetes.io/ingress.class: nginx
      # kubernetes.io/tls-acme: "true"

    ## Labels to be added to the Ingress
    ##
    labels: {}

    ## Hostnames.
    ## Must be provided if Ingress is enable.
    ##
    # hosts:
    #   - grafana.domain.com
    hosts:
      - grafana.globalhost

    ## Path for grafana ingress
    path: /

    ## TLS configuration for grafana Ingress
    ## Secret must be manually created in the namespace
    ##
    tls:
      - secretName: global-grafana-tls
        hosts:
        - grafana.globalhost

  ## Enable persistence using Persistent Volume Claims
  ## ref: http://kubernetes.io/docs/user-guide/persistent-volumes/
  ##
  persistence:
    type: pvc
    enabled: true
    # storageClassName: default
    accessModes:
      - ReadWriteOnce
    size: 10Gi
    # annotations: {}
    finalizers:
      - kubernetes.io/pvc-protection
    # selectorLabels: {}
    # subPath: ""
    # existingClaim:

    ## If persistence is not enabled, this allows to mount the
    ## local storage in-memory to improve performance
    ##
    inMemory:
      enabled: false
      ## The maximum usage on memory medium EmptyDir would be
      ## the minimum value between the SizeLimit specified
      ## here and the sum of memory limits of all containers in a pod
      ##
      # sizeLimit: 300Mi
Step 6 – Once the helm chart installation ends successfully, get the Grafana Ingress service public IP address, executing the following command:
kubectl get ingress prometheus-grafana -n monitoring
Step 7 – Configure a new hostname record in the local hosts file for grafana.globalhost domain with the service IP address obtained at Step 6.
Once Prometheus and Grafana are installed successfully, you will be able to access Grafana in your browser at https://grafana.globalhost/.
The Prometheus Web UI is not exposed outside of the AKS cluster. If you want to verify that Prometheus metrics are getting collected, you can use a kubectl port-forward command to map cluster traffic on an internal port (9090) to a local port (same in the command below) on your computer:
kubectl port-forward -n monitoring svc/prometheus-kube-prometheus-prometheus 9090
And then you can browse the Prometheus Web UI instance at http://localhost:9090/ in your browser. You can check Prometheus targets at http://localhost:9090/targets or ingested metrics at http://localhost:9090/metrics.
Custom Solution to Export Host Metrics from Windows Nodes
In this section I am going to describe how to export and collect host metrics from Windows nodes in the AKS cluster. Containers running on Windows node, where Sitecore containers run too, cannot run in privileged mode and so don’t have root permission capabilities on the node to collect metrics from the host machine. For this reason, a Prometheus node exporter running on a Windows node would fail.
The solution described in the next steps is based on the brilliant solution shared by aidapsibr’s GitHub user on their repository, consisting in two main components:
- A DSC Powershell extension for Virtual Machine Scale Set, to install the Prometheus windows-exporter service on each Windows node machine during their procurement.
- A reverse proxy container, used to expose the windows-exporter service running on the node as a service in the AKS cluster through the listening port (9100).
Step 1 – Clone the aks-prometheus-windows-exporter repository on your local machine.
Step 2 – Generate a zip archive with the content of the /aks_setup folder in the repository, named aks_setup.zip. This archive will contain an aks_setup.ps1 file and a dsc_resources folder (this one contains the .msi installer of the windows-exporter service). The aks_setup.ps1 script defines the command of the DSC Powershell extension that is installed on each node of the Virtual Machine Scale Set when the node is created. The Install-Windows-Exporter function defines the installation command and the settings for the windows-exporter service (for example: LISTEN_PORT or the list of ENABLED_COLLECTORS):
function Install-Windows-Exporter
{
    msiexec /i `
        C:\PROGRA~1\WindowsPowerShell\Modules\dsc_resources\windows_exporter-0.16.0-amd64.msi `
        LISTEN_PORT=9100 `
        ENABLED_COLLECTORS=cpu,cs,container,logical_disk,memory,net,os,service,system,tcp,time
}
The ENABLED_COLLECTORS setting can be modified to add or remove collectors. The full list of available collectors can be found here.
Step 3 – Upload the generated aks_setup.zip file in a public storage or in a storage resource accessible by the AKS cluster.
Step 4 – Open the install.ps1 powershell script file (stored in the root folder of the repository) in an editor and update the url attribute in the --settings property of the az vmss extension set command with the address to access your aks_setup.zip package. For example:
...
--settings '{\"wmfVersion\":\"latest\", \"configuration\":{\"url\":\"https://your_storage.blob.core.windows.net/files/aks_setup.zip\", \"script\":\"aks_setup.ps1\", \"function\":\"Setup\"}}' `
...
The install.ps1 script contains the definition of the Deploy-PrometheusWindowsExporter function. Add an invocation for it at the bottom of the script, specifying the subscription Id of the AKS cluster and the resource group name of the Virtual Machine Scale Set resource (that is different from the resource group of the AKS cluster). For example:
Deploy-PrometheusWindowsExporter -subscription "abcd1234-0000-0000-0000-abcd12345678" -resourceGroup "MC_sc102_sc102cluster_eastus";
Step 5 – Install the DSC Powershell extension in the VMSS Windows resource, executing the updated .\install.ps1 script in Powershell.
Once the installation succeeds, you can validate that the windows-exporter has been successfully installed in the Windows nodes of the AKS cluster, connecting to the nodes using a Bastion resource and verifying that the service runs on the machine.
The next steps will describe how to build and deploy a nginx reverse proxy to expose the windows-exporter metrics in a service that Prometheus can scrape.
Step 6 – Build the nginx reverse proxy Docker image, executing the following command in Powershell in the /docker/prometheus-nginx folder in my MonitoringSitecoreOnAKS repository:
docker build -t your_registry.azurecr.io/nginx-reverse-proxy .
Step 7 – Push the image to the Azure Container Registry resource used by the AKS cluster, executing the following command:
docker push your_registry.azurecr.io/nginx-reverse-proxy
Step 8 – Deploy the nginx reverse proxy service on the monitoring namespace of the AKS cluster, using the Kubernetes specs shared in my MonitoringSitecoreOnAKS repository. Before executing the deployment command, update the image setting defined in the /prometheus-nginx/nginx.yaml file with the name of the image in your container registry that you pushed at Step 7. Then execute from the k8s folder in the local repository the following command in Powershell to deploy the service to the AKS cluster:
kubectl apply -k ./prometheus-nginx -n monitoring
The nginx reverse proxy service is configured to have the same labels and annotations used on the Prometheus node exporter services and, thanks to them the service is automatically discovered by Prometheus.
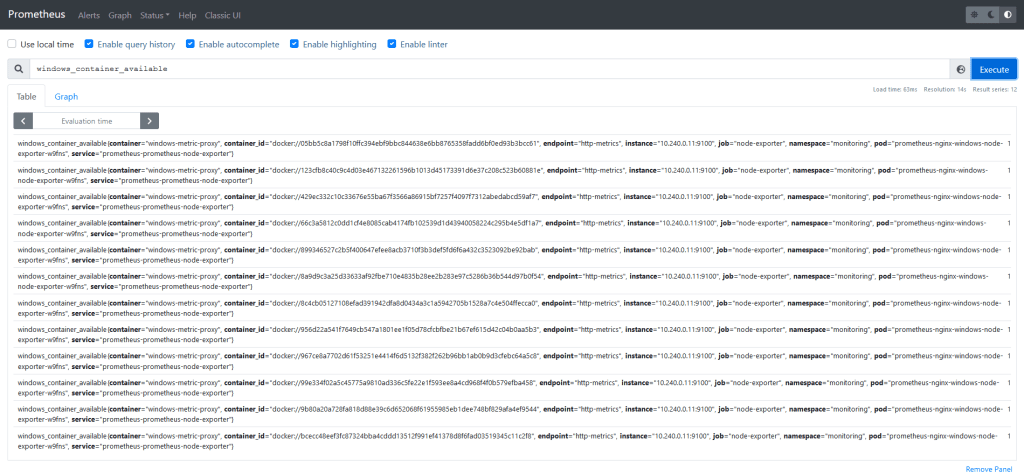
If the installation is successful, you can validate that Windows host metrics are getting collected by mapping the Prometheus Web UI service on port 9090 with the following command:
kubectl port-forward -n monitoring svc/prometheus-kube-prometheus-prometheus 9090
and querying for any Windows metrics (for example: windows_container_available):
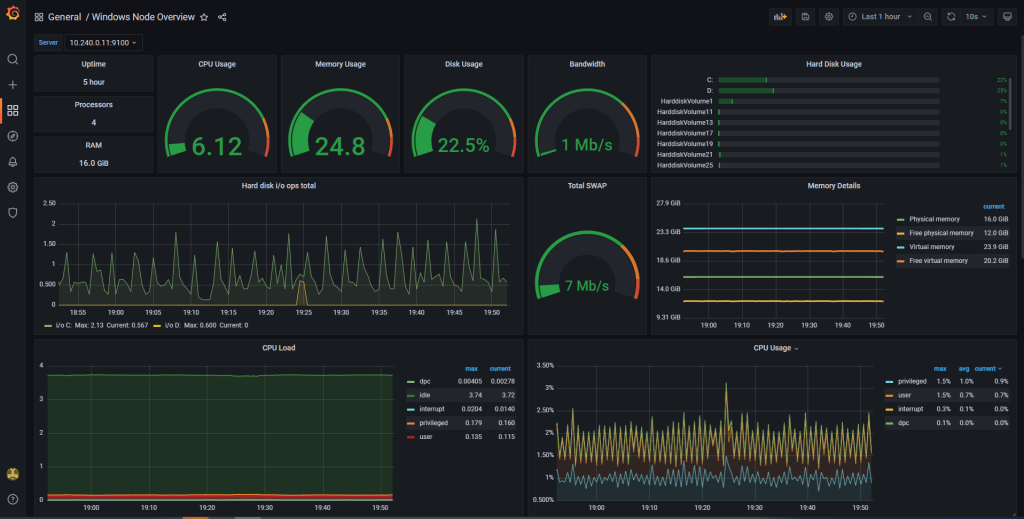
As a final step, you can create your own dashboard in Grafana to display the host metrics of the Windows nodes of the AKS cluster or you can import an existing dashboard shared on the Grafana portal. I also shared one in my MonitoringSitecoreOnAKS repository here. The dashboards created in Grafana will be stored in the persistent volume that was configured during the installation process.
Collection of Prometheus Metrics in Container Insights
Container Insights is able to collect Prometheus metrics by its containerized agents that run on each node in the AKS cluster, automatically scraping metrics exposed by exporters or application pods that are decorated with specific Prometheus annotations, like the podAnnotations that were configured in Step 5 in the Prometheus installation first section above.
The Container Insights containerized agents can be configured updating their ConfigMap specifications, in particular the prometheus-data-collection-settings configuration section, that allows to setup the scraping of Prometheus metrics at cluster level or at node level. The following steps are based on the official documentation that can be found here.
Step 1 – Download the template ConfigMap yaml file and save it as container-azm-ms-agentconfig.yaml.
Step 2 – Edit the ConfigMap template to enable monitoring of Kubernetes pods filtering by namespace (monitoring) and by label selector (app=prometheus-node-exporter). An already edited version of the file can be found in the MonitoringSitecoreOnAKS repository here.
prometheus-data-collection-settings: |-
# Custom Prometheus metrics data collection settings
    [prometheus_data_collection_settings.cluster]

...

# When monitor_kubernetes_pods = true, replicaset will scrape Kubernetes pods for the following prometheus annotations:
        # - prometheus.io/scrape: Enable scraping for this pod
# - prometheus.io/scheme: If the metrics endpoint is secured then you will need to
#     set this to `https` & most likely set the tls config.
# - prometheus.io/path: If the metrics path is not /metrics, define it with this annotation.
# - prometheus.io/port: If port is not 9102 use this annotation
monitor_kubernetes_pods = true

## Restricts Kubernetes monitoring to namespaces for pods that have annotations set and are scraped using the monitor_kubernetes_pods setting.
## This will take effect when monitor_kubernetes_pods is set to true
##   ex: monitor_kubernetes_pods_namespaces = ["default1", "default2", "default3"]
monitor_kubernetes_pods_namespaces = ["monitoring"]

## Label selector to target pods which have the specified label
## This will take effect when monitor_kubernetes_pods is set to true
## Reference the docs at https://kubernetes.io/docs/concepts/overview/working-with-objects/labels/#label-selectors
kubernetes_label_selector = "app=prometheus-node-exporter"

...
Step 3 – Deploy the updated ConfigMap in the AKS cluster executing the following command (the example command is executed from the k8s folder of the local MonitoringSitecoreOnAKS repository):
kubectl apply -f./azm-agent/container-azm-ms-agentconfig.yaml
After few minutes, once the ConfigMap has been applied successfully, you will be able to query Prometheus metrics, including Windows host metrics, directly in Azure Logs Analytics workspace of the AKS cluster, filtering by Namespace property that contains prometheus, like in this example query:
InsightsMetrics
| where Namespace contains "prometheus"
| summarize count() by Name
Conclusion
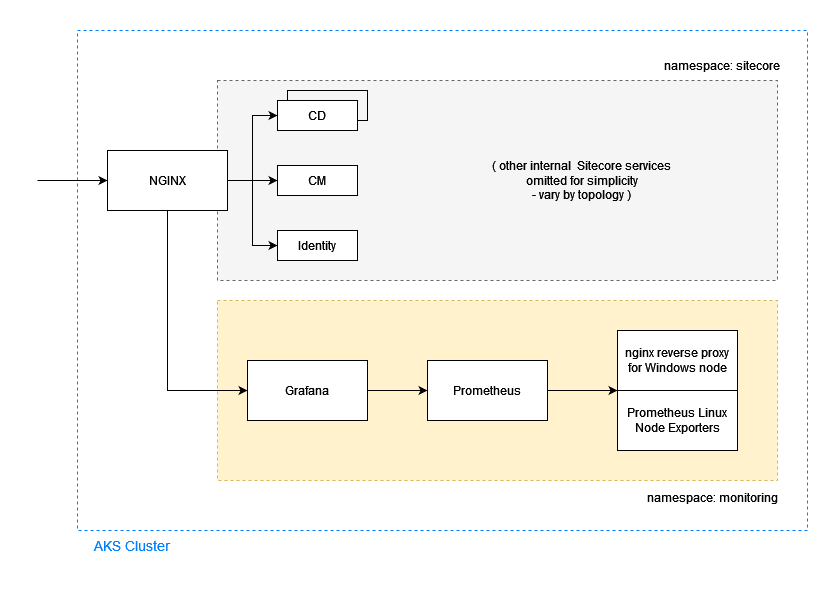
After executing the steps described in the three sections above, the Sitecore AKS cluster will have a new monitoring namespace with Prometheus, Grafana and Prometheus node metrics exporters, including a custom nginx reverse proxy to expose host metrics from the Windows nodes in the cluster, allowing to monitor and visualize host metrics not available before.
If you have any questions, please don’t hesitate to reach out or comment on this post. Thank you for reading and stay tuned for the next post!
